


Which Blue Chip companies have liability issues?
A few weeks ago we looked into the Property sector and if we should be worried an event like Evergrande could take place with the Dividend Growth Companies that are involved in the Property segment. You can read the findings here.
To make that simple we took the 3 Red Lines China holds dearly for Developers. These are ratios that look at the management of Liabilities in a company. Too much debt can kill you.
Like Evergrande more news came out that Chinese companies that got into trouble paying their debts. In light of those current events one of the Champion members asked to do a similar Liability report for the Hong Kong Blue Chip Companies. These are seen as Value investment opportunities. Goal is to see the company grow and with that the value of the stock. Dividends are a bonus. (Unless you aim for companies that have a Dividend Growth strategy and are Blue Chip. )
The nightmare we all fear is the drop in price of a Value stock that is not related to the market and her moods. Lately we saw Sands HKG:1928 drop due to licensing regulation announcements. Nightmare, horror story.
In this post the idea is to look at the debt of all the Hong Hong Blue Chip Companies and see if there are warning signs.
Blue Chip companies are expected to be okay. Still, if big Property enterprises can get hit, why not them?
Now, let’s look at the Hong Kong Blue Chips and how they manage their liabilities. Nobody wants to look at annual reports. Balance sheets are just as undesirable by most. So don’t worry, I did that for you. This is a report of both.
As numbers and data are boring, I made it as simple as possible and with clear use of color, you will be able to read into this. In this report I point to the icebergs, what is hidden underneath is yours to interpret.
That said, the following is pure data. It is not financial advise. You can take this to your team of professionals and (have them) make better educated decisions.
What are we investigating:
Are there Blue Chip companies that have a liability weakness? We want to know this because investors want to avoid events of Titanical proportions in their (client’s) portfolio’s (Need I repeat Evergrande? )
For a good analyses I looked at 4 ratios that go into dept into a companies debt.
1-Debt/Equity, total of liabilities divided by owners equity. A good ratio is between 1 and 1.5 Less than 1 is also okay, it meant there is more equity then debt. As we are looking to find positive news on the liability side of the Blue Chips. Let’s just say anything below 1.5 is green
2-Cash/ short term debt ratio. Can the current liabilities be paid with cash at hand? Not lower than 0.5 to 1 is believed healthy. That mans cash at hand should be equal or half of short term liabilities. More Cash than Current debt (ratio higher then 1) is okay too. Anything less than 0.5 is not good.
3-Total Liabilities/Assets Anything greater than 1 means the creditors owe the assets. So at .05 is means owners equity and creditors owe 50% each.
4-Net debt/equity (net gear) (Total Debt – Cash) / Book Value of Equity (incl. Goodwill and Intangibles). If the value is negative, then this means that the company has net cash, i.e. cash at hand exceeds debt. Aim for less then 1. that would mean Equity exceed debt after deduction of cash.
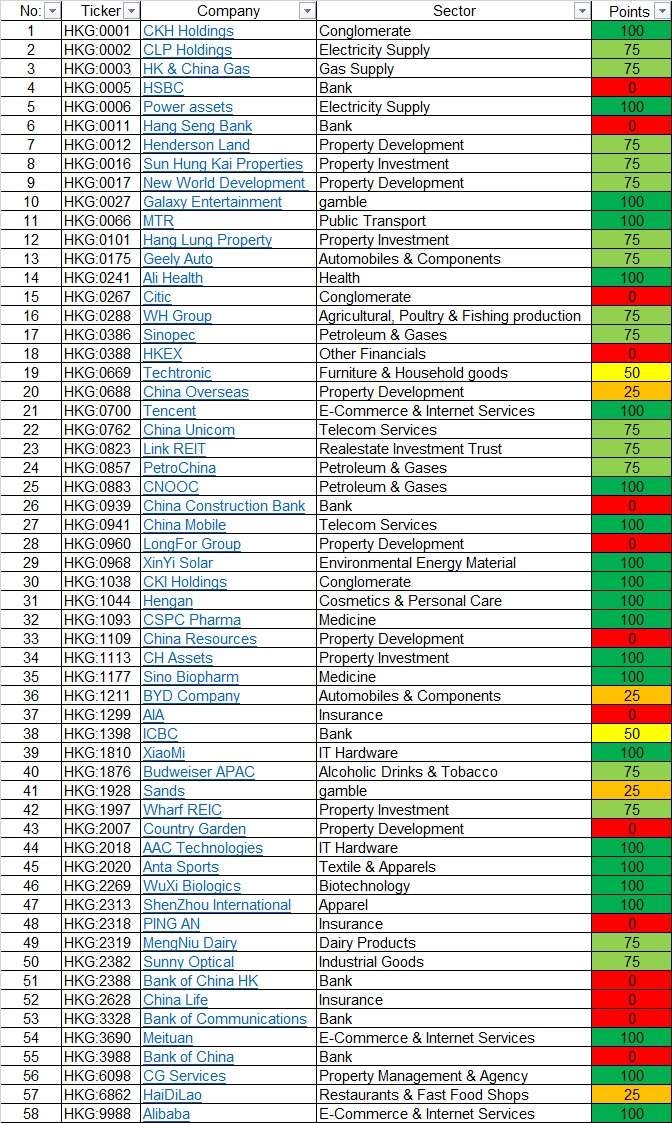
Results of these 4 ratios can only be good or bad, green of red.
This resulted in a document in which each of the outcomes was colored red=bad and green=good. Max good is 4 greens, 100 points. Maximum bad is 4 red, 0 points.
Keep in mind, Banks and Insurance companies are using different standards for their debt management. So they are all red. Not good, not bad, just different. Exception is ICBC HKG:1398 they are yellow, 50 points
What else do we see? BYD is orange, electrical cars.. Most in the Property Development and Investment are green..
Companies like Ali health, Tencent, Meituan are green.
The only restaurant HuaDiLao is orange.
Citic HKG:0267 is red. Could be trouble, could be something else.
If you want this file (.xls) for your own research, just sign up below. After your email confirmation you get the link to download the piece of useful information.
Champion members: The Blue Chip Value Insight file in the Members area just got 4 more metrics added. Here you can see the exact numbers for the 4 ratios mentioned above, colored green and red. This makes it easy to understand and super fast to read into.
Got a question, mail me Petra (@) hongkongdividendstocks . com
|
|
Sign up for freeand get immediate access to |
|
YES, FOR FREE We promise to only send you amazing helpful emails! |