
HKG:2313 SHENZHOU INTL
HKG:2313 SHENZHOU INTL operates in the field of Apparel. Shenzhou International Group Holdings Limited (2313.HK) is an investment holding company principally engaged in the manufacture and sale of knitwear products. The Company has three principal categories of products, including sports product, casual wear and lingerie. The main products include jackets, vests, pants, trousers, tops, T-shirts, dresses and lingerie. Through its subsidiaries, the Company is also engaged in the import and export of commodities in Hong Kong.
HKG:2313 SHENZHOU INTL
Last update: 17-Jun-22
Quick overview:
- Yield: 2.02%
- Lot: 100
- Price/Earnings ratio : 34.09 (Ideal <20 )
- Earnings per share : 2.760 (Ideal >0.001)
- Price as per 17-Jun-22 : HK$94.10
- Ex-Dividend Date coming up: N/A
Sector: Apparel
0
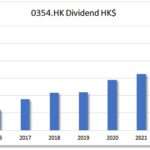
Dividend GROWTH related metrics
- Average dividend growth 1 year : 8.57%
- Average dividend growth 3 years : 33.28%
- Average dividend growth 5 years : 25.73% (Ideal >5%)
- 10% on costs in how many years: 7. How long does it take to get to 10% Dividend yield on Costs? Yield x 5-yr Average dividend growth
- Chowder rule (Yield + 5 yrs average dividend growth) : 27.75%. Ideal would be >15
- Yield 5 yr average: 1.53%
0
Let’s talk money:
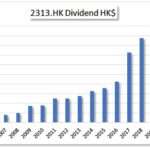
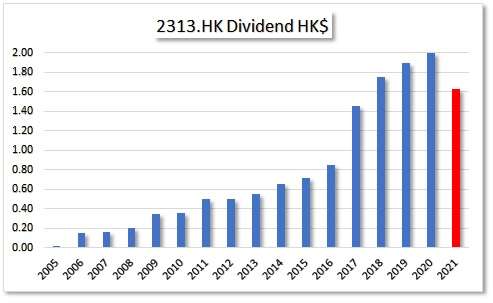
Total Dividends last year: 2.00 per share
Expected Dividends: 2.51 per share. Per lot: 251.47. Dividends last year x 5-yr average Dividend growth.
Dividends come in: HKD Mostly it will be in HKD, yet some are expressed in RMB/USD/CAD
Miscellaneous data on Dividends of the company:
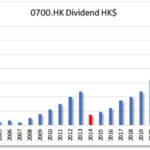
- Dividend since : 2005
- Dividend growth since : 2006
- No of years Dividend Growth: 15
- That makes this company a Contender
- Payouts/year: 2
- Payout in the following months : 6, 9.
- Ex-date : N/A
- Latest dividend announcement: HK$ 1.06
The Data on Risk of not getting a Dividend cut or worse, not getting any Dividends at all:
- Earnings per share : 2.760 (Ideal >0.001)
- Dividend payout : 49.35% (Ideal <50%)
- Dividend Coverage ratio: 1.453 Ideal >2
- EPS 5 year growth rate : 15.78 Ideal anything >0
- Return on Equity: 18.720 Ideal >10
- Years of Dividend Growth: 15. Aim above 7 years. Also check the Dividend Sheet below.
0
Let’s take a look at the liability ratios:
- Debt/Equity: 0.351 higher than 1.5 might be tricky
- Cash/Short term debt: 1.80 Ideal >1
- Total Liabilities/Assets: 0.26 Look for <1
- Net Debt/Equity: -0.06 Aim for <1
For banks, insurance companies and other financial institutions these benchmarks on liability ratios will not apply.
Data related to Value
- Price as per 17-Jun-22 : HK$
- Price/earnings ratio : (Ideal <20 )
- 52 Week low : 84.95
- 52 week high : 207.60
- Price to 52 Week Low: 10.77%
- Price to 52 week high: -54.67%
- Graham Number: 37.59 Ideal if this number is higher than current price
- Price/Book: 4.14 <3 would be the sweet spot
0
Dividend Report (incl Special Dividends, if any), the history, projection on dividend growth and how many year to get 10% Yield-on-Cost